Examples of graph
On this site you can find examples of all scripts: OSGR, MSGR,
XYGR and hereafter using of simple script HTML2GR
for generating graph from HTML table. It is an example how include MSGR sript into other script.
Beside the ilustration of graph you can see original input XML file. All pictures are in bitmap because of compatibility (SVG isn´t supported in some older browsers). You can see related SVG by clicking on the each picture.
In next picture is used "warm" colour scheme for definition of colour of all columns, but we can define or override it locally as you can see in second column. It is general behavior of all similar attributes.
|
<?xml version="1.0" encoding="UTF-8"?>
<!DOCTYPE osgr SYSTEM "osgr.dtd">
<osgr xmlns="http://graph2svg.googlecode.com"
colorScheme="warm" labelIn="percent">
<title>Revenues (in thousnds &#x20ac;)</title>
<names>
<name>Mon</name>
<name>Tue</name>
<name>Wed</name>
<name>Thu</name>
<name>Fri</name>
</names>
<values>
<value>12.5</value>
<value color="blue">10.1</value>
<value>5.8</value>
<value>9.7</value>
<value>16</value>
</values>
</osgr>
|
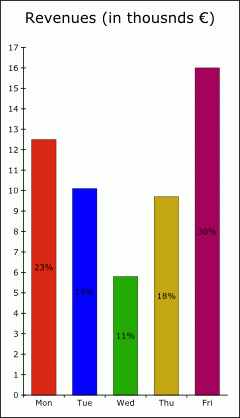
|
We can change the appearence of this graph very easy. Only by changing attributes of root element (osgr). Under pictures are quoted only these root attributes. The rest of XML file is same except local change of colour in second column
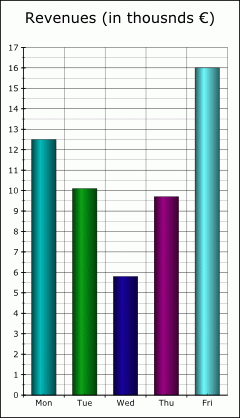
|

|
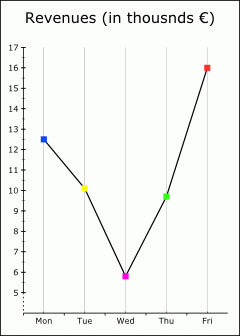
|
colType="cylinder"
colorScheme="cold"
xAxisDivision="both"
yAxisDivision="2"
xGrid="major"
yGrid="minor"
|
effect="3D"
colorScheme="warm"
xAxisDivision="both"
yAxisDivision="5"
yGrid="major"
|
colType="none"
lineType="solid"
pointType="squareF"
xAxisDivision="both"
xGrid="minor"
yAxisType="shifted"
yAxisDivision="2"
|
Graphs with one data serie could be depicted as pie chart.
|
<?xml version="1.0" encoding="UTF-8"?>
<!DOCTYPE osgr SYSTEM "osgr.dtd">
<osgr xmlns="http://graph2svg.googlecode.com"
graphType="pie" effect="3D"
legend="left" labelOut="value">
<title>Revenues (in thousnds &#x20ac;)</title>
<names>
<name>Mon</name>
<name>Tue</name> ...
</names>
<values>
<value>12.5</value>
<value>10.1</value> ...
</values>
</osgr>
|
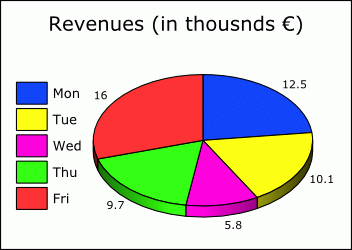
|
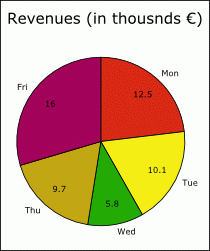
|
<?xml version="1.0" encoding="UTF-8"?>
<!DOCTYPE osgr SYSTEM "osgr.dtd">
<osgr xmlns="http://graph2svg.googlecode.com"
graphType="pie" colorScheme="warm"
labelOut="name" labelIn="value">
<title>Revenues (in thousnds &#x20ac;)</title>
<names>
<name>Mon</name>
<name>Tue</name>
...
</names>
<values>
<value>12.5</value>
<value>10.1</value>
...
</values>
</osgr>
|
For generating a graphs from data with more data series is designed MSGR type of graph. Following input file correspondet to first picture. Second picture use same data, however attributes of root element are different. You can see them below the picture.
|
<?xml version="1.0" encoding="UTF-8"?>
<!DOCTYPE msgr SYSTEM "msgr.dtd">
<msgr xmlns="http://graph2svg.googlecode.com"
pointType="circle">
<title>Production</title>
<names>
<name>Jan</name>
<name>Feb</name>
<name>Mar</name>
<name>Apr</name>
<name>May</name>
<name>Jun</name>
</names>
<values>
<title>product A</title>
<value>21</value>
<value>22</value>
<value>18</value>
<value>18</value>
<value>16</value>
<value>14</value>
</values>
<values>
<title>product B</title>
<value>10</value>
<value>12</value>
<value>9</value>
<value>11</value>
<value>15</value>
<value>18</value>
</values>
<values lineType="dot">
<title>product C</title>
<value>28</value>
<value>29</value>
<value>22</value>
<value>25</value>
<value>30</value>
<value>25</value>
</values>
</msgr>
|
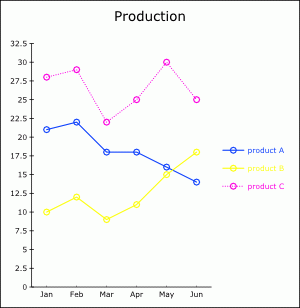
|
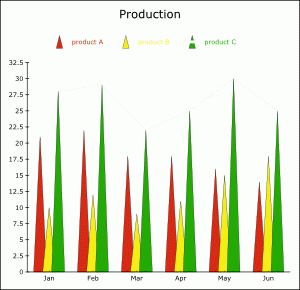 lineType="none" legend="top"
shift="0.7" colType="pyramid"
colorScheme="warm"
|
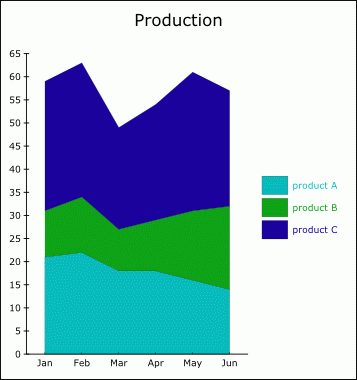
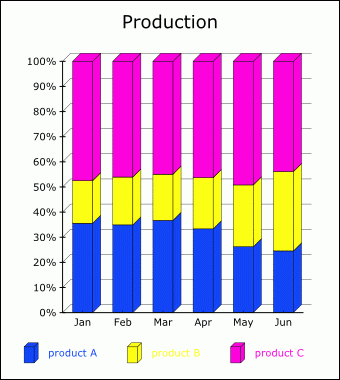
Transformation of data into stacked or percentage stacked graph is very easy.
|
|
|
stacked="sum" lineType="none"
fillArea="yes" colorScheme="cold"
|
stacked="percentage" lineType="none"
colType="block" effect="3D"
yGrid="major" legend="botom"
|
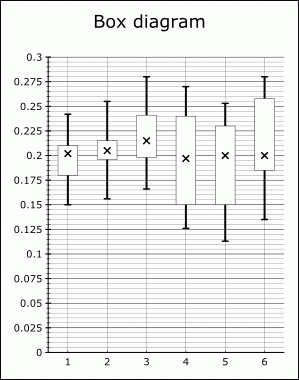
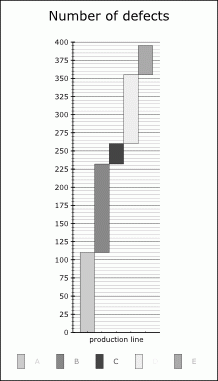
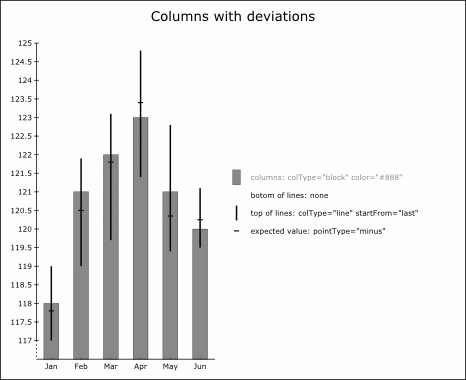
In this schema is allowed combination of diferent representation of each data serie. Box diagram, Pareth's graph or deviations can by simulated by means of special type of columns
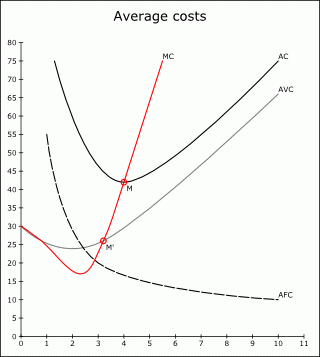
XYGR type of graph is proposed for depicting of point and curves on a plain. Each point is defined by its coordinates. For example is possible to make following schema from economic theory.
|
<?xml version="1.0" encoding="utf-8"?>
<xygr xmlns="http://graph2svg.googlecode.com"
lineType="solid">
<title>Average costs</title>
<curve smooth="yes">
<name>AC</name>
<point x="1.3" y="75"/>
<point x="4" y="42"/>
<point x="10" y="75"/>
</curve>
<curve smooth="yes" color="grey">
<name>AVC</name>
<point x="0" y="30"/>
<point x="3.2" y="26"/>
<point x="10" y="66"/>
</curve>
...
<curve color="red" pointType="circle">
<name x="3.3" y="23">M'</name>
<point x="3.2" y="26"/>
</curve>
</xygr>
|
|
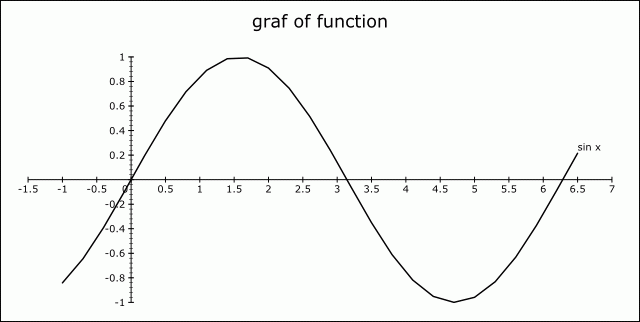
XYGR is very powerful for drawing of graph of functions. Of course it is possible to make input XML file by hand, but we show how generate function's graphs automatically by short XSLT skript.
<?xml version="1.0" encoding="windows-1250"?>
<xsl:stylesheet xmlns:xsl="http://www.w3.org/1999/XSL/Transform"
xmlns:xs="http://www.w3.org/2001/XMLSchema"
xmlns:m="http://graph2svg.googlecode.com"
xmlns:gr="http://graph2svg.googlecode.com"
xmlns:math="http://exslt.org/math"
extension-element-prefixes="math"
exclude-result-prefixes="math xs m"
version="2.0">
<xsl:include href="xygr2svg.xsl"/>
<xsl:output method="xml" encoding="utf-8" indent="yes"/>
<xsl:param name="xMin" select="-1"/> <!--minimal x-->
<xsl:param name="xMax" select="6.5"/> <!--maximal x-->
<xsl:param name="xStep" select="0.3"/> <!--step-->
<xsl:template match="/">
<xsl:variable name="gr">
<gr:xygr yAxisDivision="5">But
<gr:title>graf of function</gr:title>
<gr:curve>
<gr:name>sin x</gr:name>
<xsl:for-each select="0 to (floor(($xMax -$xMin) div $xStep) cast as xs:integer)">
<xsl:variable name="x" select="$xMin + (.)*$xStep"/> <!--x-->
<gr:point x="{$x}"
y="{math:sin($x)}"/> <!--funkction formula-->
</xsl:for-each>
</gr:curve>
</gr:xygr>
</xsl:variable>
<xsl:call-template name="m:xygr2svg">
<xsl:with-param name="graph" select="$gr/gr:xygr"/>
</xsl:call-template>
</xsl:template>
</xsl:stylesheet>
|
HTML2GR is quite simple script which extract data from HTML (respectivly XHTML) table and transform them to picture. It is a next example how use two scripts together specifically msgr2svg is included. Because XSLT processors can't work with HTML directly, we have to transform HTML to XHTM. We can use e.g. TIDY.
<?xml version="1.0" encoding="windows-1250"?>
<xsl:stylesheet xmlns:xsl="http://www.w3.org/1999/XSL/Transform"
xmlns:xh="http://www.w3.org/1999/xhtml"
xmlns:m="http://graph2svg.googlecode.com"
xmlns:gr="http://graph2svg.googlecode.com"
exclude-result-prefixes="m xh" version="2.0">
<xsl:include href="msgr2svg.xsl"/>
<xsl:output method="xml" encoding="utf-8" indent="yes"/>
<xsl:param name="tabNum" select="1"/> <!--placings of table in input file-->
<xsl:param name="dataCols" select="2 to 12"/> <!--sequence of data columns-->
<xsl:param name="dataRows" select="3 to 6"/> <!--sequence of data rows-->
<xsl:param name="titlesCol" select="1"/> <!--coumn with titles of data series-->
<xsl:param name="namesRow" select="2"/> <!--row with names (x axis)-->
<xsl:param name="grTitleRow" select="1"/> <!--title of whole graph (row)-->
<xsl:param name="grTitleCol" select="1"/> <!--title of whole graph (coumn)-->
<xsl:template match="/">
<xsl:variable name="graph">
<xsl:apply-templates select="(//xh:table)[$tabNum]"/>
</xsl:variable>
<xsl:call-template name="m:msgr2svg">
<xsl:with-param name="graph" select="$graph/gr:msgr"/>
</xsl:call-template>
<!--xsl:apply-templates select="(//xh:table)[$tabNum]"/-->
</xsl:template>
<xsl:template match="xh:table">
<xsl:variable name="rows" select="(xh:tr|xh:tbody/xh:tr|xh:thead/xh:tr|xh:tfoot/xh:tr)"/>
<gr:msgr pointType="cross">
<gr:title><xsl:value-of select="(m:row2seq($rows[$grTitleRow]))[$grTitleCol]"/></gr:title>
<gr:names>
<xsl:for-each select="(m:row2seq($rows[$namesRow]))[position() = $dataCols]">
<gr:name>
<xsl:value-of select="."/>
</gr:name>
</xsl:for-each>
</gr:names>
<xsl:for-each select="$rows[position() = $dataRows]">
<gr:values>
<title> <xsl:value-of select="m:row2seq(.)[$titlesCol]"/> </title>
<xsl:for-each select="m:row2seq(.)[position() = $dataCols]">
<gr:value>
<xsl:value-of select="translate(., ',+', '.')"/>
</gr:value>
</xsl:for-each>
</gr:values>
</xsl:for-each>
</gr:msgr>
</xsl:template>
<xsl:function name="m:row2seq">
<xsl:param name="row"/>
<xsl:sequence select="
for $a in $row/(xh:td|xh:th) return
if ($a/@colspan) then (
(for $b in (1 to $a/@colspan) return $a)
) else $a"/>
</xsl:function>
</xsl:stylesheet>



![]() graph2svg, author: Jakub Vojtíšek
graph2svg, author: Jakub Vojtíšek