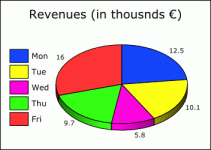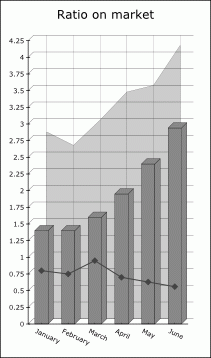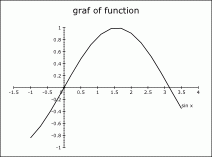

Graph2svg is the set of three scripts which automatically transform data into the graphic form in the SVG format. It make a graph or chart. For description of data is used XML format. Result is a picture in SVG format which can by used directly or transformed into different graphics format. There is a wide variety of tools.
Because of SVG is an open format based on XML, can be used XSLT transformation language for the transformation. We using XSLT 2.0 in graph2svg.
Three types of XML schemas are defined for different types of graphs or charts. The graphs are divided systematically into three types not according to their visual form but according to the number of data series which they are formed with:


If you look at examples you see large variety of graph2svg. You can learn how the final appearance of a graph can be changed by means of the setting of only several attributes. The data series can be depicted as several types of columns with the optional 3D effect, as various marks or as pointed or smooth lines of many types with the possibility of the filling of surrounded areas. The series can be colour-coded and it is possible to set their individual appearance as well. The size of graphs, the layout of graph parts and limits of data axes are calculated automatically. It enables the great variability of depicting possibilities.
Briefly, graph2svg is a set of three DTD schemas for depicting of graphs and three XSLT scripts for transformation of these graphs into SVG.
![]() graph2svg, autor: Jakub Vojtíšek
graph2svg, autor: Jakub Vojtíšek